Ruchira Papers Ltd.
BUY
Performance Update
CMP
`188
Target Price
`244
Y/E March (` cr)
3QFY18
3QFY17
% yoy
2QFY18
% qoq
Net sales
118
102
15
104
13
Investment Period
12 Months
EBITDA
23
16
39
16
41
Stock Info
EBITDA margin (%)
19.3
15.9
3.4
15.4
3.9
Sector
Paper
Market Cap (` cr)
419
A djusted PAT
11.9
8.1
48
8.4
42
Net Debt (` cr)
70
Source: Company, Angel Research
Beta
1.0
52 Week High / Low
220/122
Avg. Daily Volume
28,947
During 3QFY2018, Ruchira Papers (RPL) posted results in-line with our
Face Value (`)
10
expectations on top-line and bottom-line fronts. Revenue grew by 15% yoy to
BSE Sensex
34,300
Nifty
10,540
`118cr, driven by strong realisation growth of ~15%. On the operating front,
Reuters Code
RCHR.NS
Bloomberg Code
RUCP.IN
margins expanded by 340bps yoy due to lower raw material cost and other
expenses. This led to an increase in PAT by 47.7% yoy to `11.9cr.
Shareholding Pattern (%)
Promoters
61.1
Top-line driven by strong realisation growth: Revenue grew by 15% yoy to
MF / Banks / Indian Fls
0.0
FII / NRIs / OCBs
1.5
`118cr, driven by strong realisation growth of ~15%. On the segmental front,
Indian Public / Others
37.3
sales volume of writing & printing paper segment fell by 2.5%, while that of kraft
Abs.(%)
3m
1yr
3yr
paper increased by 3.5%.
Sensex
3.8
21.4
18.1
RUCHIRA
17.0
49.7
466.3
Higher revenue, better operating performance propelled profitability: On the
operating front, margins expanded by 340bps yoy due to an increase in sales
and lower raw material cost and other expenses as compared to the year ago
quarter. This led to PAT growth of ~48% yoy to `11.8cr.
Outlook and Valuation: We forecast RPL to report healthy top-line CAGR of
~13% over FY17-20E on the back of healthy demand in printing & writing paper
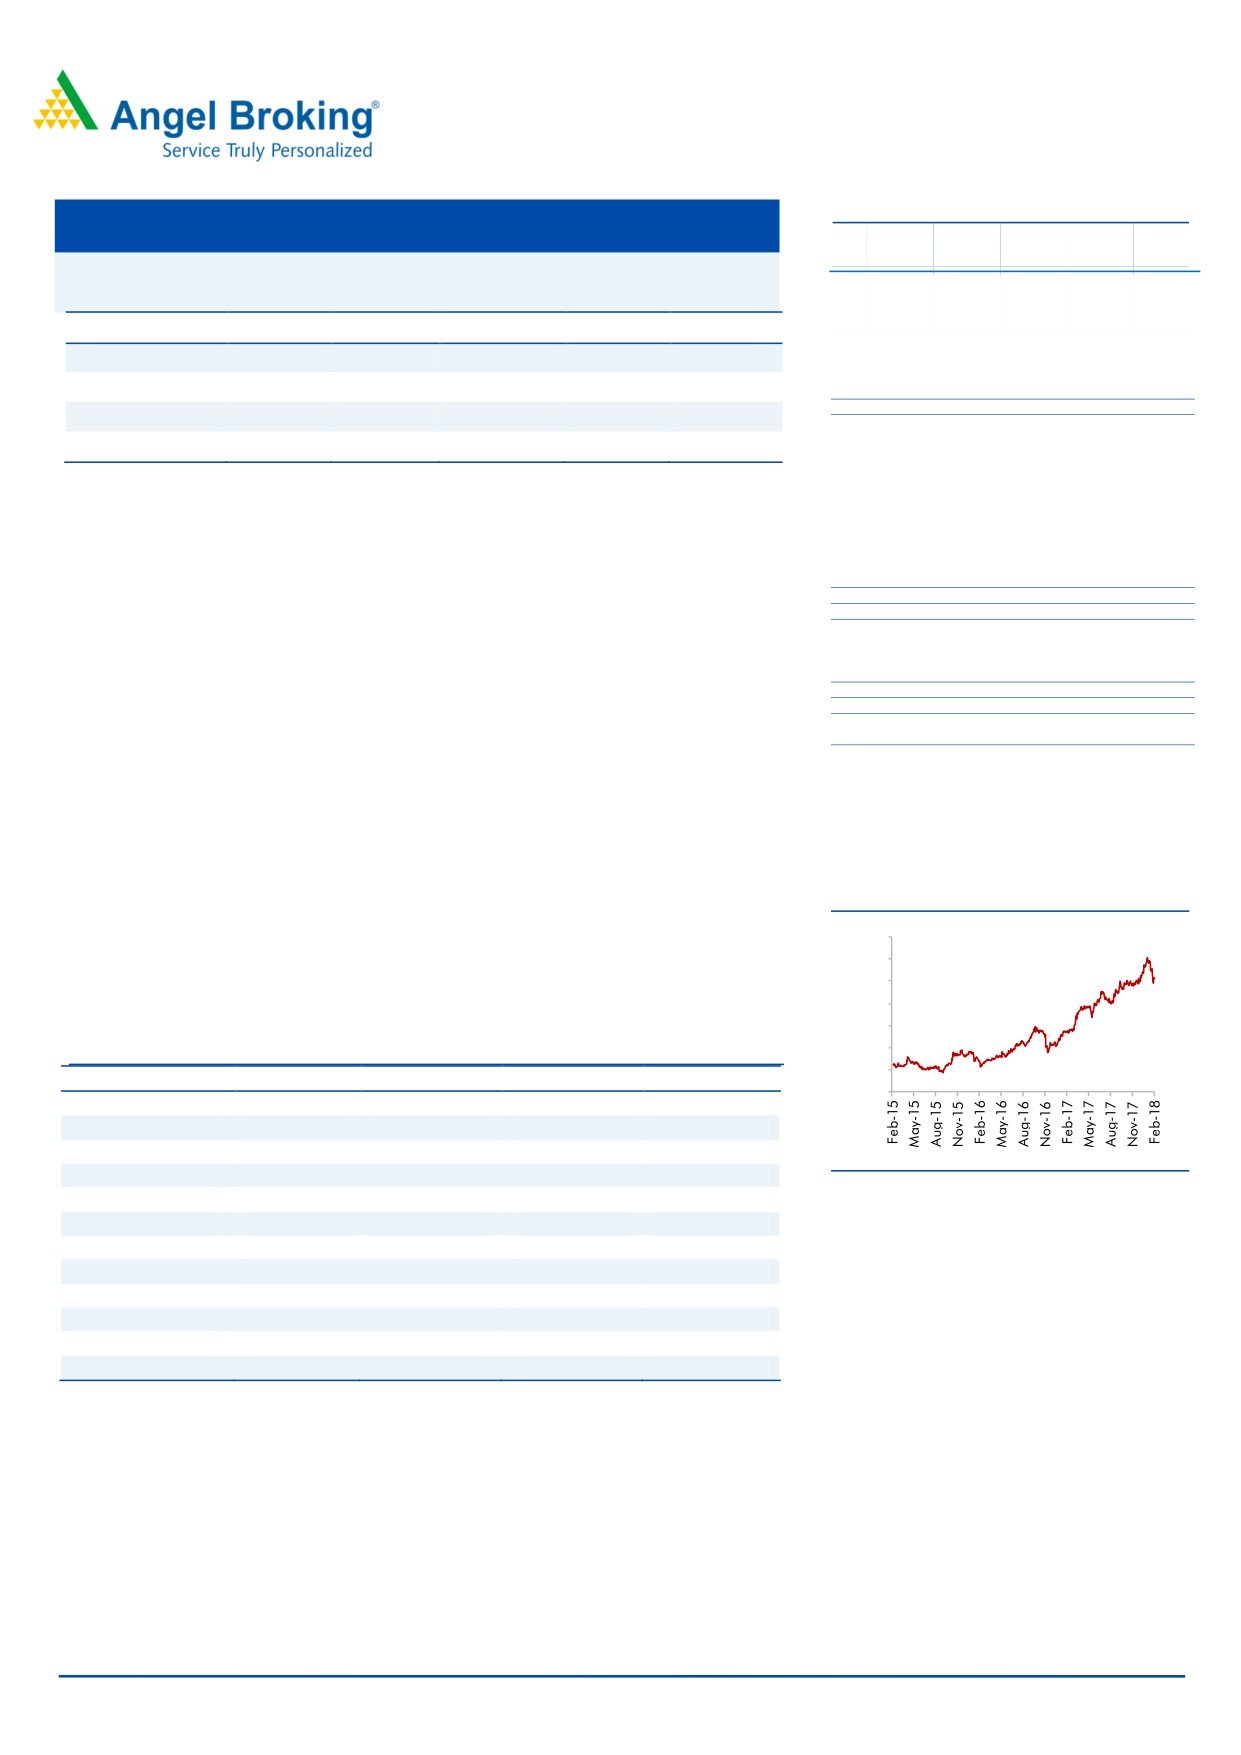
3-year price chart
and kraft paper segments. On the bottom-line front, we estimate ~16% CAGR
over FY17-20E owing to strong improvement in operating performance. Further,
700
enhanced manufacturing efficiencies and benefits from increasing global finished
600
500
paper prices would aid margins. We maintain our Buy recommendation on the
400
stock with a target price of `244 (11x FY2020E EPS).
300
200
Key financials
100
Y/E March (` cr)
FY2016
FY2017
FY2018E
FY2019E
0
Net Sales
363
416
470
532
% chg
4.6
14.8
12.9
13.3
Net Profit
19.4
32.1
36.9
42.5
% chg
51.0
64.9
15.2
15.0
Source: Company, Angel Research
OPM (%)
13.1%
15.2%
15.6%
15.6%
EPS (`)
8.7
14.3
16.5
19.0
P/E (x)
21.7
13.1
11.4
9.9
P/BV (x)
3.5
2.8
18.8
1.9
RoE (%)
16.1
21.0
164.8
19.2
Amarjeet S Maurya
RoCE (%)
19.6
23.6
56.9
22.8
022-39357800 Ext: 6831
EV/Sales (x)
1.4
1.2
1.1
0.9
EV/EBITDA (x)
10.4
7.7
6.8
5.9
Source: Company, Angel Research, Note: CMP as of February 15, 2018
Please refer to important disclosures at the end of this report
1
Ruchira Papers| 3QFY2018 Result Update
Exhibit 1: 3QFY2018 Consolidated Performance
Y/E March (` cr)
3QFY18
3QFY17
% yoy
2QFY18
% qoq
9MFY18
9MFY17
% chg
Net Sales
118
102
14.8
104
13.0
340
302
12.6
Consumption of RM
70
65
8.0
63
11.2
205
193
6.4
(% of Sales)
59.6
63.4
60.6
60.3
63.8
Staff Costs
11
8
34.1
11
(1.2)
31
23
31.0
(% of Sales)
8.9
7.7
10.2
9.0
7.7
Other Expenses
14
13
6.4
14
(0.3)
43
38
13.8
(% of Sales)
12.2
13.1
13.8
12.8
12.6
Total Expenditure
94.9
86
10.1
88
7.8
279
254
9.8
Operating Profit
22.66
16
39.4
16
41.3
61
48
27.4
OPM
19.3
15.9
15.4
18.0
15.9
Interest
2.1
2.0
2.5
1.5
41.8
5
7
(18.2)
Depreciation
3.0
2.7
10.8
2.8
4.6
9
8
10.1
Other Income
0.82
0
1
2
0
682.1
PBT (excl. Ext Items)
18
12
59.0
13
43.7
49
34
45.7
Ext (Income)/Expense
PBT (incl. Ext Items)
18
12
59.0
13
43.7
49
34
45.7
(% of Sales)
15.7
11.3
12.3
14.5
11.2
Provision for Taxation
7
4
4
17
11
(% of PBT)
35.5
30.6
34.7
35.0
32.9
Reported PAT
11.89
8.05
47.7
8.38
41.9
32
23
41.0
PATM
10.1
7.9
8.1
9.4
7.5
Minority Interest After NP
Extra-ordinary Items
0
0
0
Reported PAT
11.88
8.05
47.6
8.38
41.8
32.06
22.77
40.8
Source: Company, Angel Research
February 16, 2018
2
Ruchira Papers| 3QFY2018 Result Update
Key investment arguments
Healthy demand in paper segment to drive growth: Indian paper industry is
estimated to grow at a CAGR of 7.6% over the next couple of years, in-line
with India’s GDP growth. Further, Kraft paper segment is also growing at a
faster rate due to strong demand from packaging industry (owing to increasing
e-commerce and FMCG demand). We believe that the company has
diversified product portfolio in both the segments, which would assist in
capturing growing demand.
Ban in China to boost paper prices: The Chinese Government has banned the
import of waste paper, which is the primary raw material for finished paper.
Thus, the production of finished paper would be impacted in China. This in
turn, would lead to an increase in the prices of finished paper. Eventually, the
paper manufacturing companies like RPL would witness volume growth and
also benefit due to the increase paper prices.
Upgradation of existing units to improve production efficiency : Company has
planned a capex of `42cr (funded by term loan of `27cr and balance through
internal accruals) for upgradation and modernization of existing units. This will
facilitate RPL to introduce new range of value added products in its Kraft paper
unit coupled with an increase in Paper Machine speed from
640
meters/minute to 700 meters/minute in writing and printing paper unit. This
modernization plan will be implemented in January 2018 and company will
start reaping its benefits from 1QFY2019 onwards. Further, RPL has plans to
setup a green field project in the state of Punjab
February 16, 2018
3
Ruchira Papers| 3QFY2018 Result Update
Outlook and Valuation
We forecast RPL to report healthy top-line CAGR of ~13% over FY17-20E on the
back of healthy demand in printing & writing paper and kraft paper segments. On
the bottom-line front, we estimate ~16% CAGR over FY17-20E owing to strong
improvement in operating performance. Further, enhanced manufacturing
efficiencies and benefits from increasing global finished paper prices would aid
margins. We maintain our Buy recommendation on the stock with a target price of
`244 (11x FY2020E EPS).
Company Background
Ruchira Papers Limited (RPL) is an India based company, which manufactures
paper and paper products. The company is engaged in the process of
manufacturing writing and printing paper and Kraft paper. RPL’s white writing
and printing paper is used to make notebooks and writing material, while the
colored paper is used in the fabrication of spiral notebooks, wedding cards,
shade cards, children's coloring books, colored copier paper and bill books. Its
Kraft paper is utilized in the packaging industry for making corrugated
boxes/cartons and for other packaging requirements. The company’s writing
and printing paper is manufactured by using agricultural residues li ke wheat
straw, bagasse, sarkanda and other materials. Its semi Kraft paper is
manufactured by using agriculture residues like bagasse, wheat straw, rice
straw, sarkanda and indigenous materials, etc. The company offers its
products to customers in India and overseas.
February 16, 2018
4
Ruchira Papers| 3QFY2018 Result Update
Consolidated Profit & Loss Statement
Y/E March (` cr)
FY2016
FY2017
FY2018E
FY2019E
FY2020E
Total operating income
363
416
470
532
603
% chg
4.6
14.8
12.9
13.3
13.3
Total Expenditure
315
353
397
449
509
Raw Material
233
265
298
338
382
Personnel
30
34
39
44
49
Others Expenses
53
54
60
68
77
EBITDA
47
63
73
83
94
% chg
21.4
33.3
15.9
13.3
13.3
(% of Net Sales)
13.1
15.2
15.6
15.6
15.6
Depreciation& Amortisation
10
11
12
13
13
EBIT
38
53
61
70
81
% chg
28.6
38.7
16.0
14.6
15.2
(% of Net Sales)
10.5
12.7
13.0
13.1
13.4
Interest & other Charges
7
8
8
9
9
Other Income
1
1
1
1
1
(% of PBT)
3.8
2.2
1.8
1.6
1.4
Share in profit of Associ ates
-
-
-
-
-
Recurring PBT
32
46
54
62
73
% chg
55.4
44.0
18.7
15.0
17.0
Tax
12
14
17
20
23
(% of PBT)
38.7
30.0
32.0
32.0
32.0
PAT (reported)
19
32
37
42
50
Minority Interest (after tax)
-
-
-
-
-
Profit/Loss of Associate Company
-
-
-
-
-
Extraordinary Items
0
(0)
-
-
-
ADJ. PAT
19
32
37
42
50
% chg
51.0
64.9
15.2
15.0
17.0
(% of Net Sales)
5.4
7.7
7.9
8.0
8.2
Basic EPS (`)
8.7
14.3
16.5
19.0
22.2
Fully Diluted EPS (`)
8.7
14.3
16.5
19.0
22.2
% chg
51.0
64.9
15.2
15.0
17.0
Source: Company, Angel Research
February 16, 2018
5
Ruchira Papers| 3QFY2018 Result Update
Consolidated Balance Sheet
Y/E March (` cr)
FY2016
FY2017E
FY2018E
FY2019E
FY2020E
SOURCES OF FUNDS
Equity Share Capital
22
22
22
22
22
Reserves& Surplus
98
130
199
243
Shareholders Funds
121
153
22
222
266
Minority Interest
-
-
-
-
-
Total Loans
73
70
85
85
85
Deferred Tax Liability
27
29
29
29
29
Total Liabilities
221
252
136
335
379
APPLICATION OF FUNDS
Gross Block
274
290
320
332
342
Less: Acc. De preciation
101
112
124
137
151
Net Block
173
178
196
195
192
Capital Work-in-Progress
-
3
3
3
3
Investments
-
-
-
-
-
Current Assets
94
123
157
193
244
Inventories
41
55
66
77
91
Sundry De btors
34
44
55
66
78
Cash
2
2
5
13
30
Loans & Advances
17
22
31
37
45
Other Assets
0
0
0
1
1
Current liabilities
47
54
59
58
61
Net Current Assets
47
69
98
136
183
Deferred Tax Asset
1
1
1
1
1
Mis. Exp. not written off
-
-
-
-
-
Total Assets
221
252
298
335
379
Source: Company, Angel Research
February 16, 2018
6
Ruchira Papers| 3QFY2018 Result Update
Consolidated Cashflow Statement
Y/E March (` cr)
FY2016
FY2017E FY2018E FY2019E FY2020E
Profit before tax
32
46
54
62
73
Depreciation
10
11
12
13
13
Change in Working Capital
2
(18)
(26)
(30)
(30)
Interest / Dividend (Net)
6
7
0
0
0
Direct taxes paid
(8)
(11)
(17)
(20)
(23)
Others
(0)
0
0
0
0
C ash Flow from Operati ons
40
33
23
26
33
(Inc.)/ Dec. i n Fixed Assets
(33)
(20)
(30)
(12)
(10)
(Inc.)/ Dec. i n Inve stments
1
1
0
0
0
C ash Flow from Inve sting
(32)
(19)
(30)
(12)
(10)
Issue of Equity
0
0
0
0
0
Inc./(Dec.) in loans
2
(3)
15
0
0
Dividend Paid (Incl. T ax)
(3)
(3)
(5)
(6)
(6)
Interest / Divide nd (Net)
(7)
(8)
0
0
0
C ash Flow from Financing
(9)
(14)
10
(6)
(6)
Inc./(Dec.) in Cash
(0)
0
3
8
17
O pening Cash balance s
2
2
2
5
13
Closing Cash balances
2
2
5
13
30
Source: Company, Angel Research
February 16, 2018
7
Ruchira Papers| 3QFY2018 Result Update
Key Ratios
Y/E March
FY2016
FY2017E FY2018E FY2019E FY2020E
Valuati on Ratio (x)
P/E (on FDEPS)
21.7
13.1
11.4
9.9
8.5
P/CEPS
14.5
9.9
8.6
7.6
6.7
P/BV
3.5
2.8
18.8
1.9
1.6
Dividend yield (%)
0.7
0.8
1.2
1.3
1.3
EV/Sales
1.4
1.2
1.1
0.9
0.8
EV/EBITDA
10.4
7.7
6.8
5.9
5.1
EV / Total Assets
2.2
1.9
1.7
1.5
1.3
Per Share Data (`)
EPS (Basic)
8.7
14.3
16.5
19.0
22.2
EPS (fully diluted)
8.7
14.3
16.5
19.0
22.2
Cash EPS
12.9
19.0
21.9
24.8
28.2
DPS
1.3
1.5
2.3
2.5
2.5
Book Value
53.8
68.1
10.0
98.8
118.5
Returns (%)
ROCE
19.6
23.6
56.9
22.8
23.0
Angel ROIC (Pre-tax)
19.8
23.8
59.4
23.8
25.1
ROE
16.1
21.0
164.8
19.2
18.7
Turnover rati os (x)
Asset Turnover (Gross Block)
1.3
1.4
1.5
1.6
1.8
Inventory / S ales (days)
41
49
51
53
55
Receivables (days)
35
38
43
45
47
Payables (days)
15
17
15
14
14
Working capital cycle (ex-cash) (days)
61
70
79
84
88
Source: Company, Angel Research
February 16, 2018
8
Ruchira Papers| 3QFY2018 Result Update
Research Team Tel: 022 - 39357800
DISCLAIMER
Angel Broking Private Limited (hereinafter referred to as “Angel”) is a registered Member of National Stock Exchange of India Limited,
Bombay Stock Exchange Limited and MCX Stock Exchange Limited. It is also registered as a Depository Participant with CDSL and
Portfolio Manager with SEBI. It also has registration with AMFI as a Mutual Fund Distributor. Angel Broking Private Limited is a registered
entity with SEBI for Research Analyst in terms of SEBI (Research Analyst) Regulations, 2014 vide registration number INH00000 0164.
Angel or its associates has not been debarred/ suspended by SEBI or any other regulatory authority for accessing /dealing in securi ties
Market. Angel or its associates including its relatives/analyst do not hold any financial interest/beneficial ownership of mo re than 1% in
the company covered by Analyst. Angel or its associates/analyst has not received any compensation / managed or co -managed public
offering of securities of the company covered by Analyst during the past twelve months. Angel/analyst has not served as an officer,
director or employee of company covered by Analyst and has not been engaged in market making activity of the company covered by
Analyst.
This document is solely for the personal information of the recipient, and must not be singularly used as the basis of any investment
decision. Nothing in this document should be construed as investment or financial advice. Each recipient of this document sho uld make
such investigations as they deem necessary to arrive at an independent evaluation of an investment in the securities of the companies
referred to in this document (including the merits and risks involved), and should consult their own advisors to determine th e merits and
risks of such an investment.
Reports based on technical and derivative analysis center on studying charts of a stock's price movement, outstanding positions and
trading volume, as opposed to focusing on a company's fundamentals and, as such, may not match with a report on a company's
fundamentals.
The information in this document has been printed on the basis of publicly available information, internal data and other reliable sources
believed to be true, but we do not represent that it is accurate or complete and it should not be relied on as such, as this document is for
general guidance only. Angel Broking Pvt. Limited or any of its affiliates/ group companies shall not be in any way responsible f or any
loss or damage that may arise to any person from any inadvertent error in the information contained in this report. Angel Broking Pvt.
Limited has not independently verified all the information contained within this document. Accordingly, we cannot testify, no r make any
representation or warranty, express or implied, to the accuracy, contents or data contained within this document. While Angel Broking
Pvt. Limited endeavors to update on a reasonable basis the information discussed in this material, there may be regulatory, c ompliance,
or other reasons that prevent us from doing so.
This document is being supplied to you solely for your information, and its contents, information or data may not be reproduced,
redistributed or passed on, directly or indirectly.
Neither Angel Broking Pvt. Limited, nor its directors, employees or affiliates shall be liable for any loss or damage that may arise from or
in connection with the use of this information.
Note: Please refer to the important ‘Stock Holding Disclosure' report on the Angel website (Research Section). Also, please r efer to the
latest update on respective stocks for the disclosure status in respect of those stocks. Angel Broking Pvt. Limited and its affiliates may have
investment positions in the stocks recommended in this report.
February 16, 2018
9